Using flamegraphs
What's a flamegraph?
Here's a very basic introduction to flamegraphs. Everything in here is true for flamegraphs in general, not just the flamegraphs rbspy generates.
Flamegraphs are a way to visualize how your program is spending its time. A few important things about flamegraphs:
- The x axis on the flamegraph doesn't represent time.
- The SVGs have Javascript in them and they're interactive! You can search with ctrl+f!
- You can't tell from a flamegraph how many times a function was called. You can only tell how much time was spent in the function.
Reading a flamegraph
Flamegraphs are generated from a series of stack traces. To get an idea for how this works, let's pretend that our profiler has collected 4 stack traces, as follows.
a;d 1
b;d 1
a;b;c 1
a;b;c;d 1
Here's the flamegraph. It's generated by sorting the above stack traces (so that all the as are
together) and arranging them vertically into a chart. In this one, the main method is at the top.

What this tells us is:
- 75% (3/4) of the stack traces we collected started in the
afunction - 50% (2/4) of the stack traces started with
acallingband then callingc.
A simple real example
To get a tiny bit more complicated -- here's a very simple Ruby program that spends 20% of its time
running the panda function, and 80% of its time running the cucumber function.
def panda
    sleep(0.20)
end

def potato
    cucumber
end

def cucumber
    sleep(0.80)
end

loop do
    panda
    potato
end
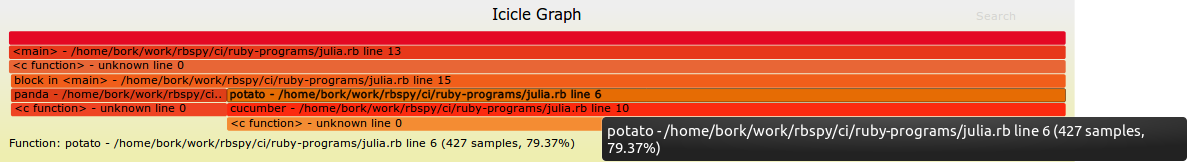
Here's the flamegraph! There's a panda bar in the flame graph that takes up 20% of the x axis, and
potato and cucumber bars that take up 80% of the x axis. This means that 80% of the time was
spent in potato/cucumber and 20% in panda.

If you click on the above flamegraph, you'll get an interactive SVG -- you can hover over any part
of the flamegraph to get the % of samples that were in that function. In this example, 79.37% of the
samples were in the potato function.
A more complicated flamegraph: Jekyll
Here's a much more complicated flamegraph generated by rbspy. The way I usually read flamegraphs
is to look for big wide sections (because they represent a large part of the program's execution)
There are 2 things that jump out to me about this flamegraph:
- there's an
initializefunction where 5.9% of the time is spent. Not that much time is being spent in initialization! - 86.6% of the time is spent in
process_site, and if you look a little further down, you can see thatrender_documentsplits into 3 separate functions:convert,place_in_layouts, andrender_liquid. That means thatrender_documentcalled those 3 methods, and that, whilerender_documentdid call other methods, it didn't spend a substantial amount of time in any other method.
This is neat! I'm not familiar with the Jekyll codebase at all, but just by looking through this flamegraph I can understand a few important things about how the code is structured.
Here's the slice that jumps out at me (where render_document splits into the 3 methods it calls).
Basically the thing to look for here is where the big slice (which takes up ~80% of the program)
breaks into smaller slices, because that tells you what the program's main phases are.

and the whole flamegraph:

When don't flamegraphs work well? (recursion!)
Flamegraphs don't work well with highly recursive programs. When you have a program with a lot of
recursion, what will happen is that the function you're calling recursively will appear over and
over again multiple times in each stack trace. If you have a very recursive program that you want to
analyze in depth, using a callgrind visualization instead might work better.
For example, Rubocop uses a lot of recursion. In this flamegraph from a Rubocop execution, we see
that the on_block, on_begin, on_while, etc functions get called over and over and over again
in a lot of different places, and it's very hard to learn anything from the flamegraph except that
there's a lot of recursion.

A simple text summary gives us more insight into what's going on (7.6% of the time is spent in
advance!) than the flamegraph does.
Summary of profiling data so far:
% self  % total  name
  7.65     8.99  advance - /home/bork/.rbenv/versions/2.4.0/lib/ruby/gems/2.4.0/gems/parser-2.4.0.2/lib/parser/lexer.rb
  4.83    11.31  each_child_node - /home/bork/.rbenv/versions/2.4.0/lib/ruby/gems/2.4.0/gems/rubocop-0.52.1/lib/rubocop/ast/node.rb
  3.66     8.65  block in tokens - /home/bork/.rbenv/versions/2.4.0/lib/ruby/gems/2.4.0/gems/rubocop-0.52.1/lib/rubocop/cop/mixin/surrounding_s
  3.33     3.33  source_range - /home/bork/.rbenv/versions/2.4.0/lib/ruby/gems/2.4.0/gems/rubocop-0.52.1/lib/rubocop/ast/node.rb
  2.50    29.28  block (2 levels) in on_send - /home/bork/.rbenv/versions/2.4.0/lib/ruby/gems/2.4.0/gems/rubocop-0.52.1/lib/rubocop/cop/commiss
  2.50     2.50  block in offensive? - /home/bork/.rbenv/versions/2.4.0/lib/ruby/gems/2.4.0/gems/rubocop-0.52.1/lib/rubocop/cop/style/commented
  2.50     2.50  block (2 levels) in find_common_characters - /home/bork/.rbenv/versions/2.4.0/lib/ruby/gems/2.4.0/gems/rubocop-0.52.1/lib/rubo
  2.16     9.65  block in each_child_node - /home/bork/.rbenv/versions/2.4.0/lib/ruby/gems/2.4.0/gems/rubocop-0.52.1/lib/rubocop/ast/node.rb
  1.83    15.31  do_parse - /home/bork/.rbenv/versions/2.4.0/lib/ruby/2.4.0/racc/parser.rb
  1.83     1.83  to_s - /home/bork/.rbenv/versions/2.4.0/lib/ruby/gems/2.4.0/gems/rubocop-0.52.1/lib/rubocop/cop/badge.rb
  1.83     1.83  rspec_pattern - /home/bork/.rbenv/versions/2.4.0/lib/ruby/gems/2.4.0/gems/rubocop-rspec-1.22.0/lib/rubocop/cop/rspec/cop.rb
  1.66     2.66  cop_config - /home/bork/.rbenv/versions/2.4.0/lib/ruby/gems/2.4.0/gems/rubocop-0.52.1/lib/rubocop/cop/cop.rb
  1.50     1.50  end_pos - /home/bork/.rbenv/versions/2.4.0/lib/ruby/gems/2.4.0/gems/rubocop-0.52.1/lib/rubocop/token.rb
  1.33     1.50  style_detected - /home/bork/.rbenv/versions/2.4.0/lib/ruby/gems/2.4.0/gems/rubocop-0.52.1/lib/rubocop/cop/mixin/configurable_e
  1.16     2.00  to_a - /home/bork/.rbenv/versions/2.4.0/lib/ruby/gems/2.4.0/gems/ast-2.3.0/lib/ast/node.rb
  1.16     1.16  initialize - /home/bork/.rbenv/versions/2.4.0/lib/ruby/gems/2.4.0/gems/rubocop-0.52.1/lib/rubocop/cop/cop.rb
  1.16     1.16  block (2 levels) in of - /home/bork/.rbenv/versions/2.4.0/lib/ruby/gems/2.4.0/gems/unicode-display_width-1.3.0/lib/unicode/dis
  1.00     9.48  tokens - /home/bork/.rbenv/versions/2.4.0/lib/ruby/gems/2.4.0/gems/rubocop-0.52.1/lib/rubocop/cop/mixin/surrounding_space.rb
  1.00     2.50  block (2 levels) in <class:Node> - /home/bork/.rbenv/versions/2.4.0/lib/ruby/gems/2.4.0/gems/rubocop-0.52.1/lib/rubocop/ast/no
  1.00     2.16  block in on_module - /home/bork/.rbenv/versions/2.4.0/lib/ruby/gems/2.4.0/gems/rubocop-0.52.1/lib/rubocop/cop/commissioner.rb